Service Strategy for Automotive Customer Experience
Designed a dashboard that helps everyday drivers track maintenance, invoices, and upcoming service. Reducing mistrust at the point of sale while supporting healthier vehicles and more informed service decisions.
00

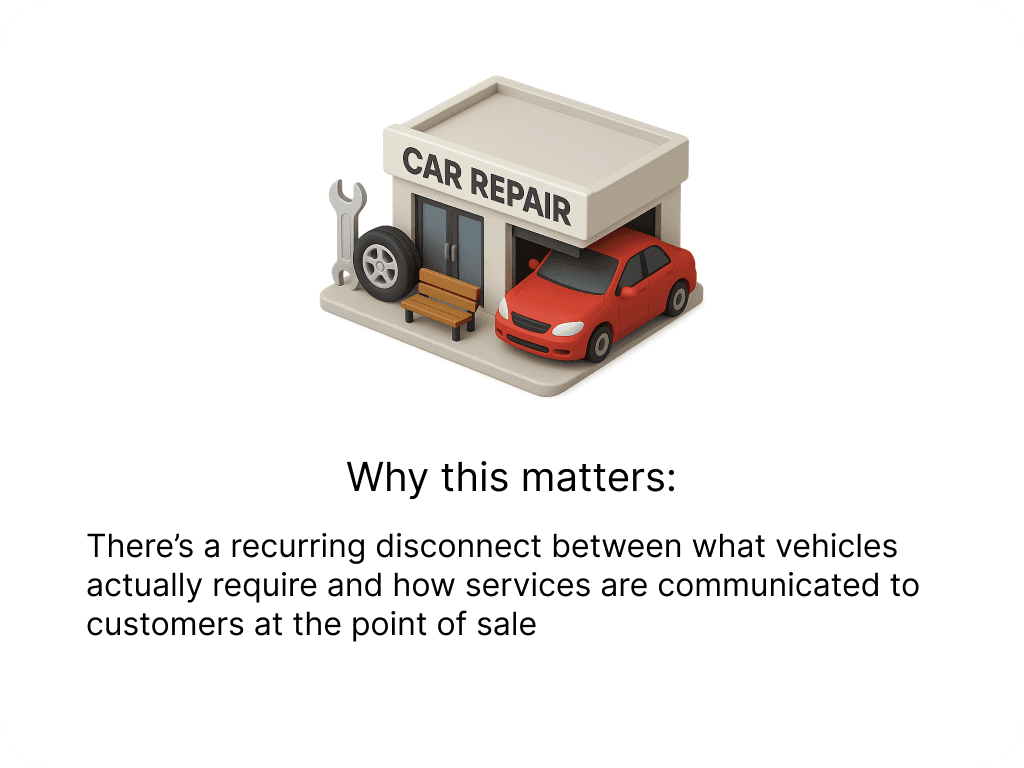
problem
Pop-in auto shops have a negative reputation for misrepresenting vehicle needs, causing customers to resist even essential maintenance.
solution
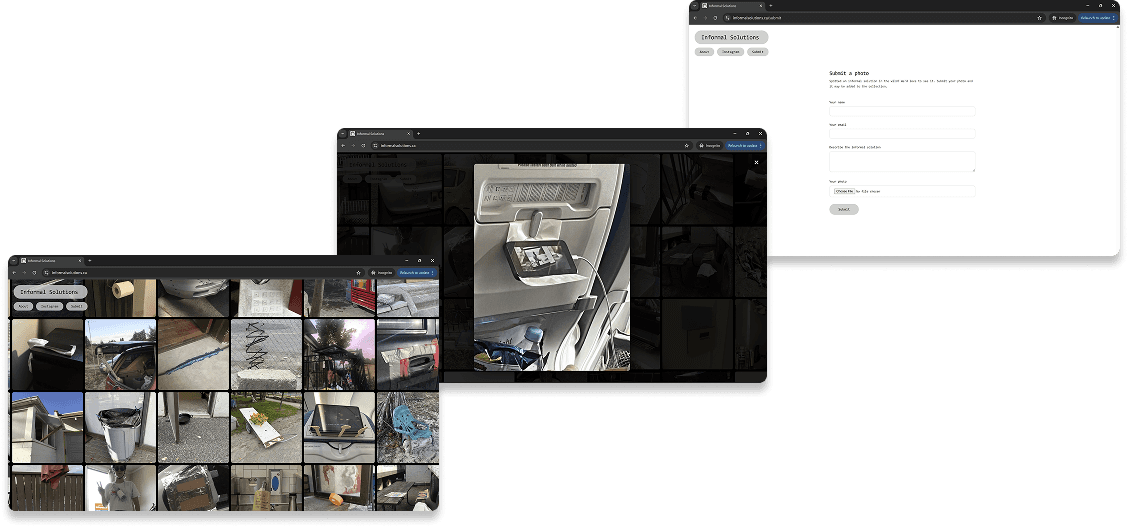
I created Service Stack, a user dashboard designed for everyday drivers. It centralizes your vehicle’s service history, reminders, and receipts, making maintenance easy to manage.
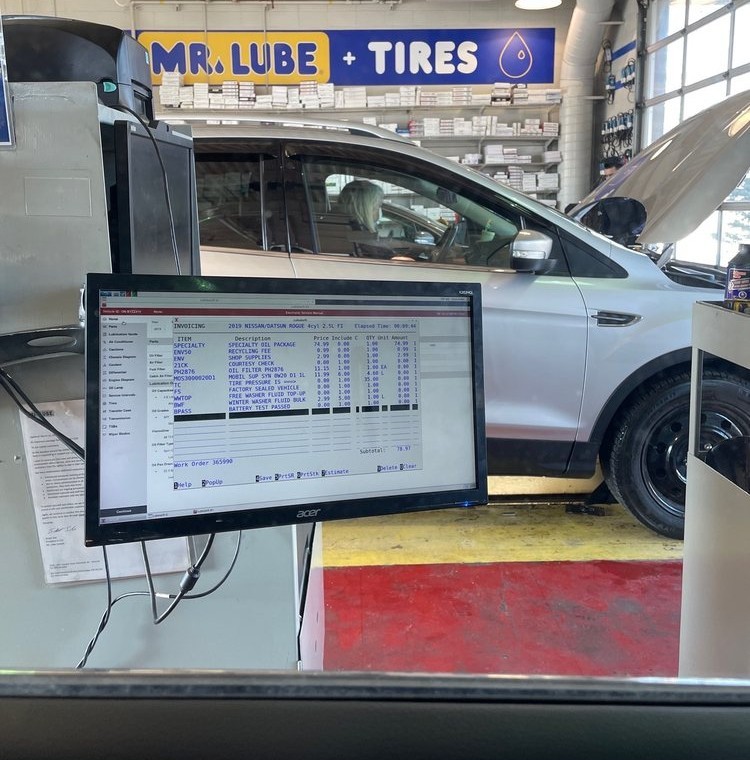
An ambiguous interface is presented at time of service.
People wanting a simple oil change are forced to decipher this list of services the technician is proposing. It contains; the proposed maintenance, services that are free, and results of tests done on the car, with no visual distinction between each.
Audience
The majority of Canadians own their own vehicles, with Statistics Canada reporting that 26.3 million road motor vehicles were registered nationwide in 2022. To support this large population of drivers, no-appointment auto repair shops are widespread across both Canada and the United States, offering convenient, on-demand maintenance. Brands such as Jiffy Lube, Car Hub, Mr. Lube, Midas, and many others cater to vehicle owners who need quick, walk-in services without the friction of scheduling appointments.
Desk Research
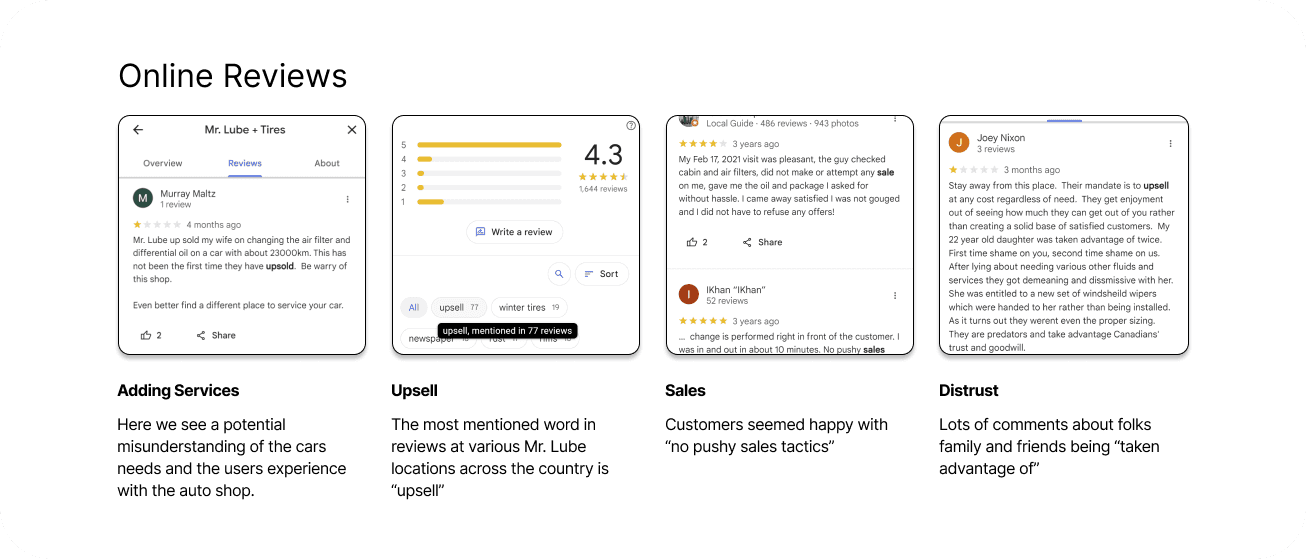
To confirm my suspicions that there was room for improvement, I conducted qualitative user research by reviewing online customer feedback for auto repair shops across the country. Across these reviews, the most frequently mentioned theme was “upsell,” often framed negatively. While some customers explicitly praised locations for having “no pushy sales tactics,” many others expressed distrust, sharing stories of friends or family members feeling taken advantage of.
Field Research
I conducted 12 semi-structured interviews with customers outside Mr. Lube locations. Rather than recruiting participants in advance, I approached people in context, immediately after a service visit to capture honest, unfiltered reactions rather than reconstructed memories.
The interview script was designed to surface both functional and emotional dimensions of the experience: how people track service history, how they perceive technician expertise relative to their own, and how they feel at the moment a recommendation is made.
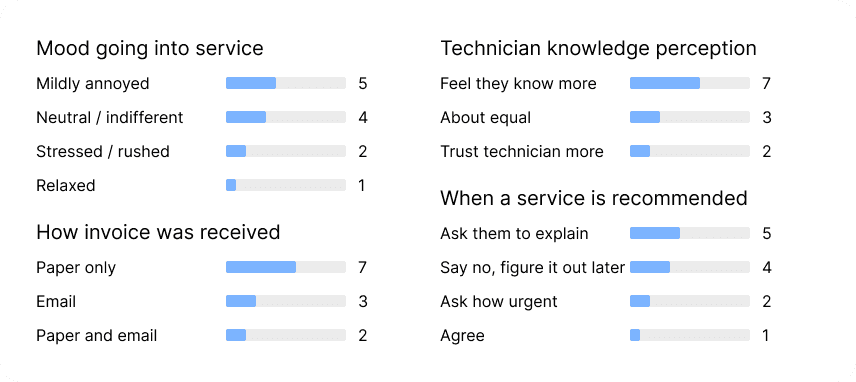
A consistent and surprising tension emerged: most participants rated themselves low on automotive knowledge, yet simultaneously felt they understood their own vehicle better than the technician recommending additional work. This isn't contradiction, it's a signal that the problem is relational, not informational.
Key Insights
Trust breaks down at the moment of service, not before or after
Customers often interpret additional recommendations as sales tactics rather than care
Mixed information (diagnostics, free checks, proposed services) increases cognitive load
Paper receipts prevent long-term visibility into vehicle health and spending
Customers want control and understanding, not avoidance of maintenance
Designing Continuity Between Digital and Physical Touchpoints
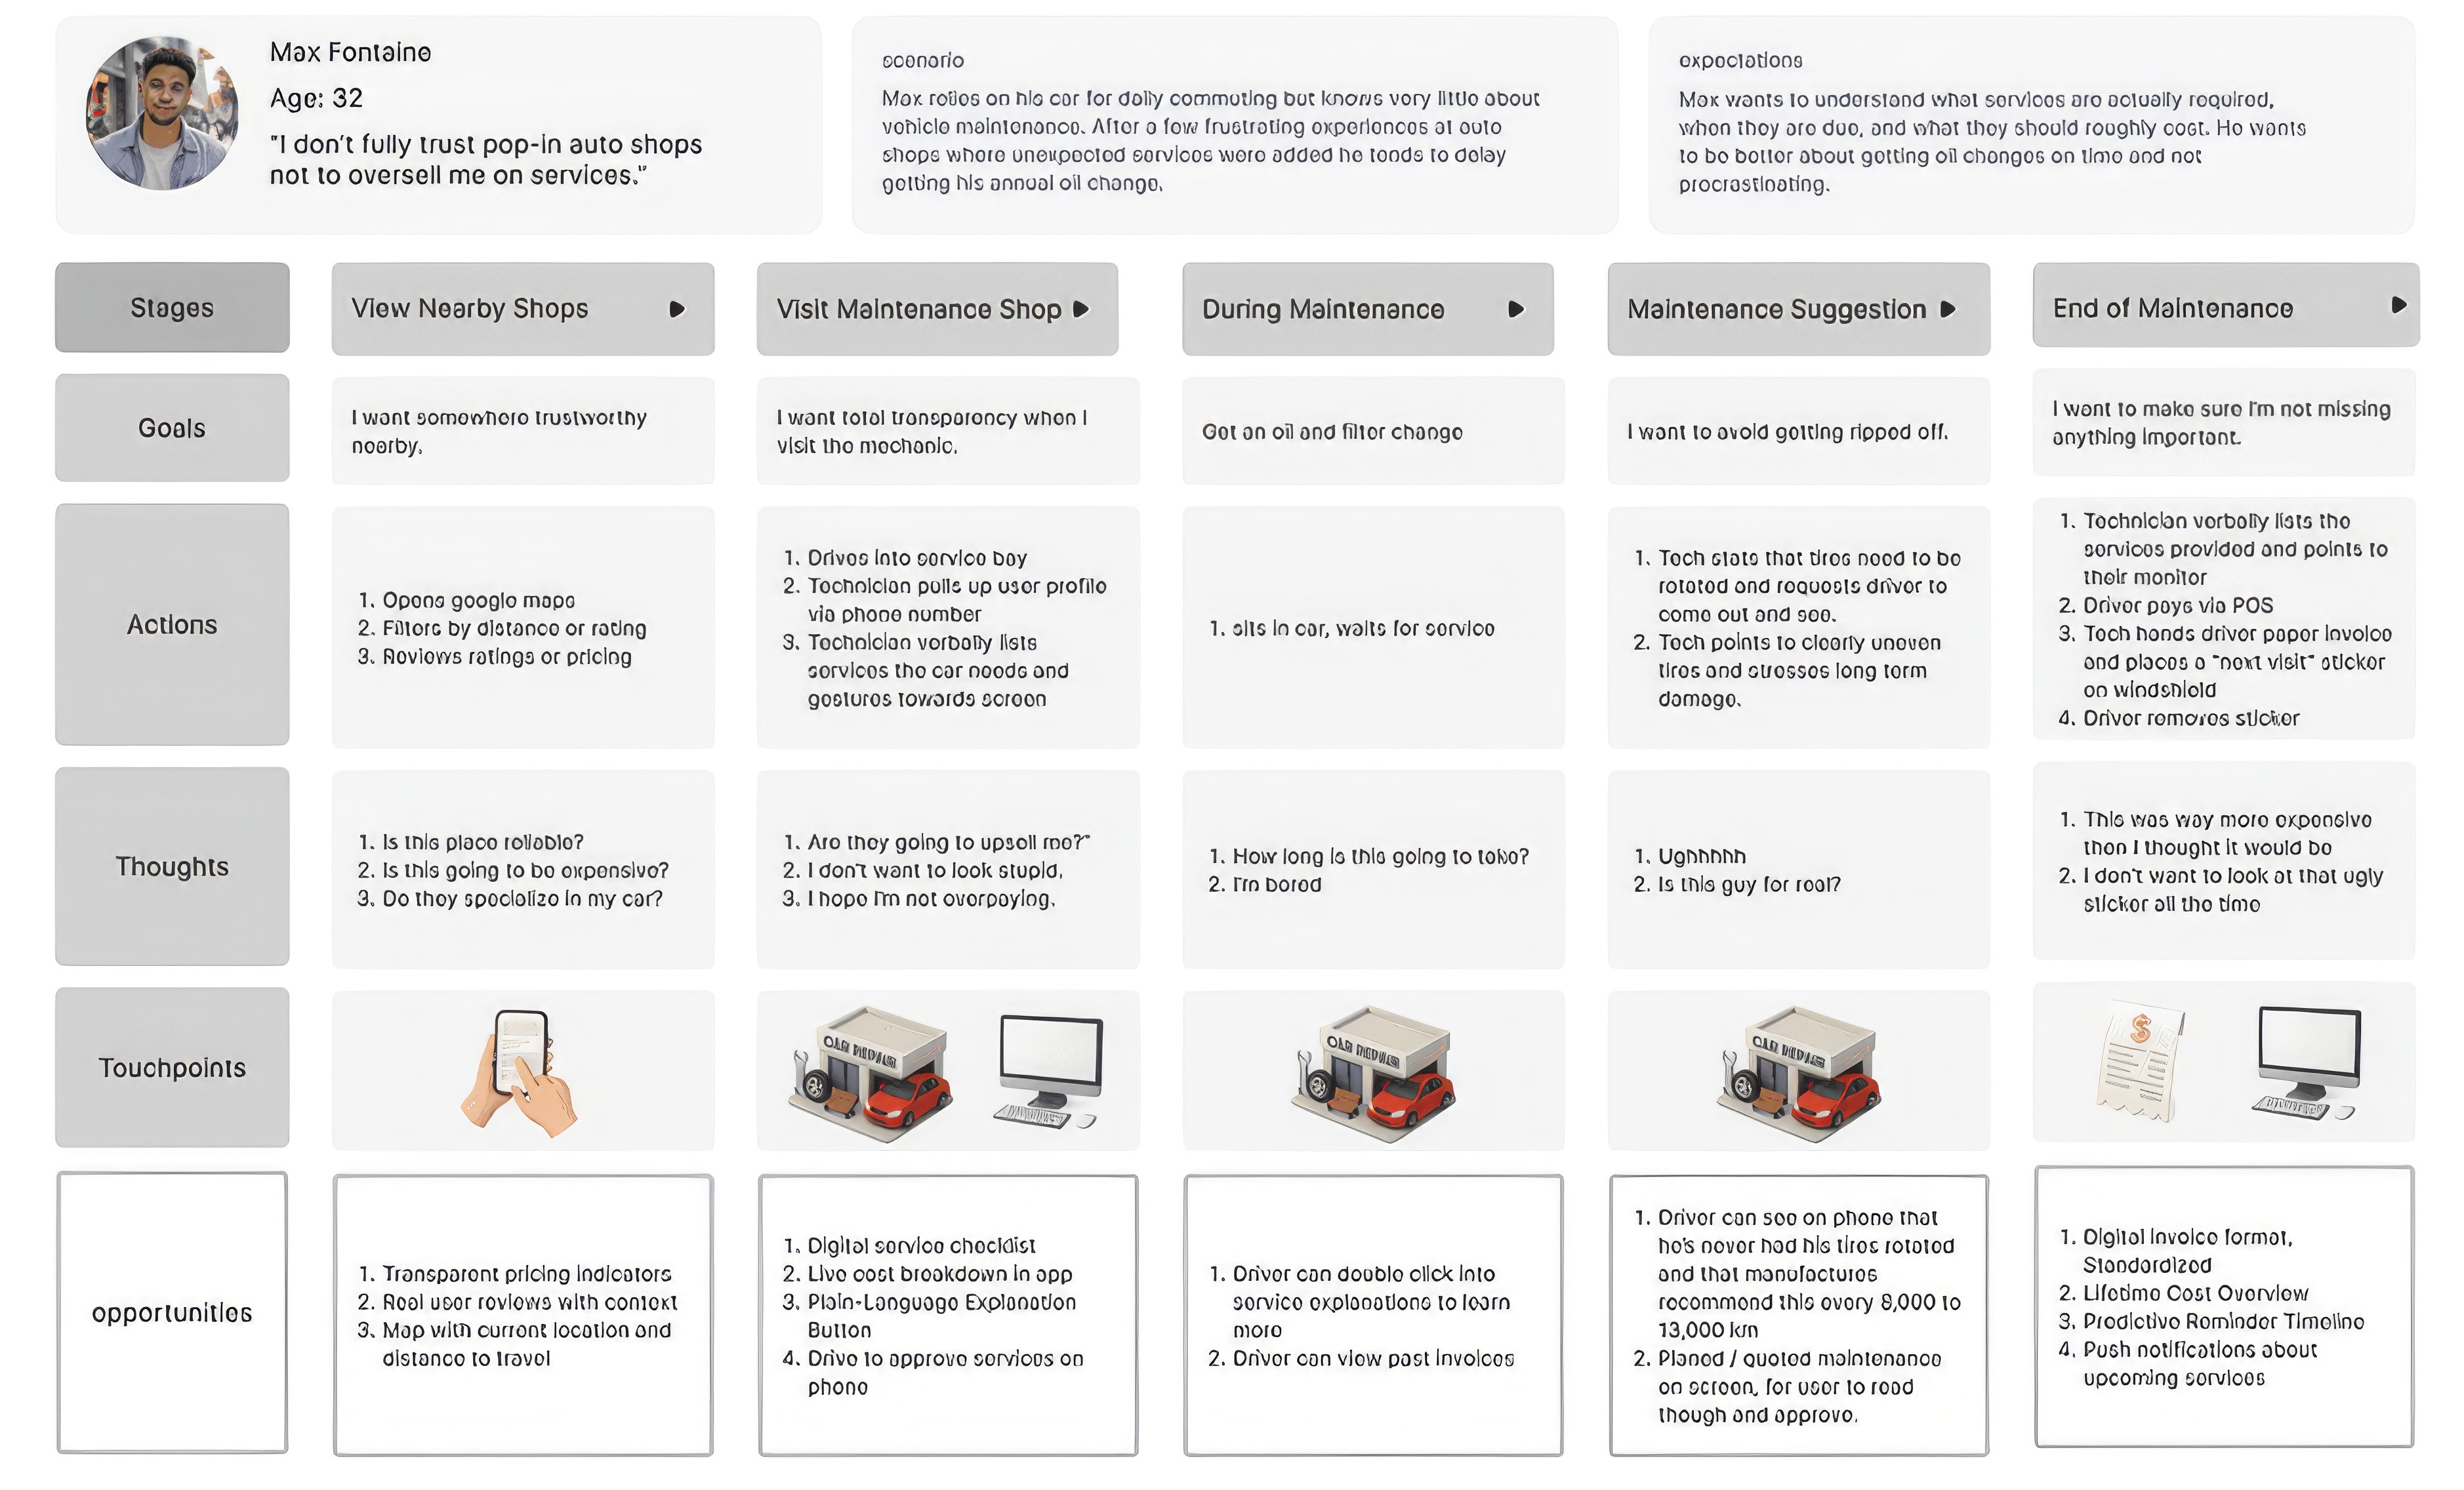
The biggest tension point is in the handoff between digital and physical. The journey map surfaced five distinct stages in a driver's relationship with vehicle maintenance: signing up, viewing upcoming services, finding a nearby shop, visiting the shop, and reviewing invoices after the fact.
At each stage, the opportunities row of the map tells a consistent story: users needed transparent rationale, plain language, and shared context, not more features. The visit to the shop itself sits at the centre, where the service relationship is either won or lost. Everything before it builds confidence; everything after it either confirms or undermines it.
From Insights To Design Principles
Longitudinal visibility over transactional snapshots
The service should persist across visits, not reset each time.
Shared context between user and technician
Both actors in the service encounter should have access to the same vehicle history at the same moment.
Progressive disclosure of complexity
Surface what's urgent and overdue first; let users pull more detail when they want it rather than presenting everything at once.
Platform Decision
Research suggested the core user base skewed toward middle-aged men who weren't habitual app users. Designing a native app would have introduced an adoption barrier before the service could demonstrate its value. A web-based application lowered that friction while still supporting a fully responsive mobile experience for users who preferred it.
Proposed Solution
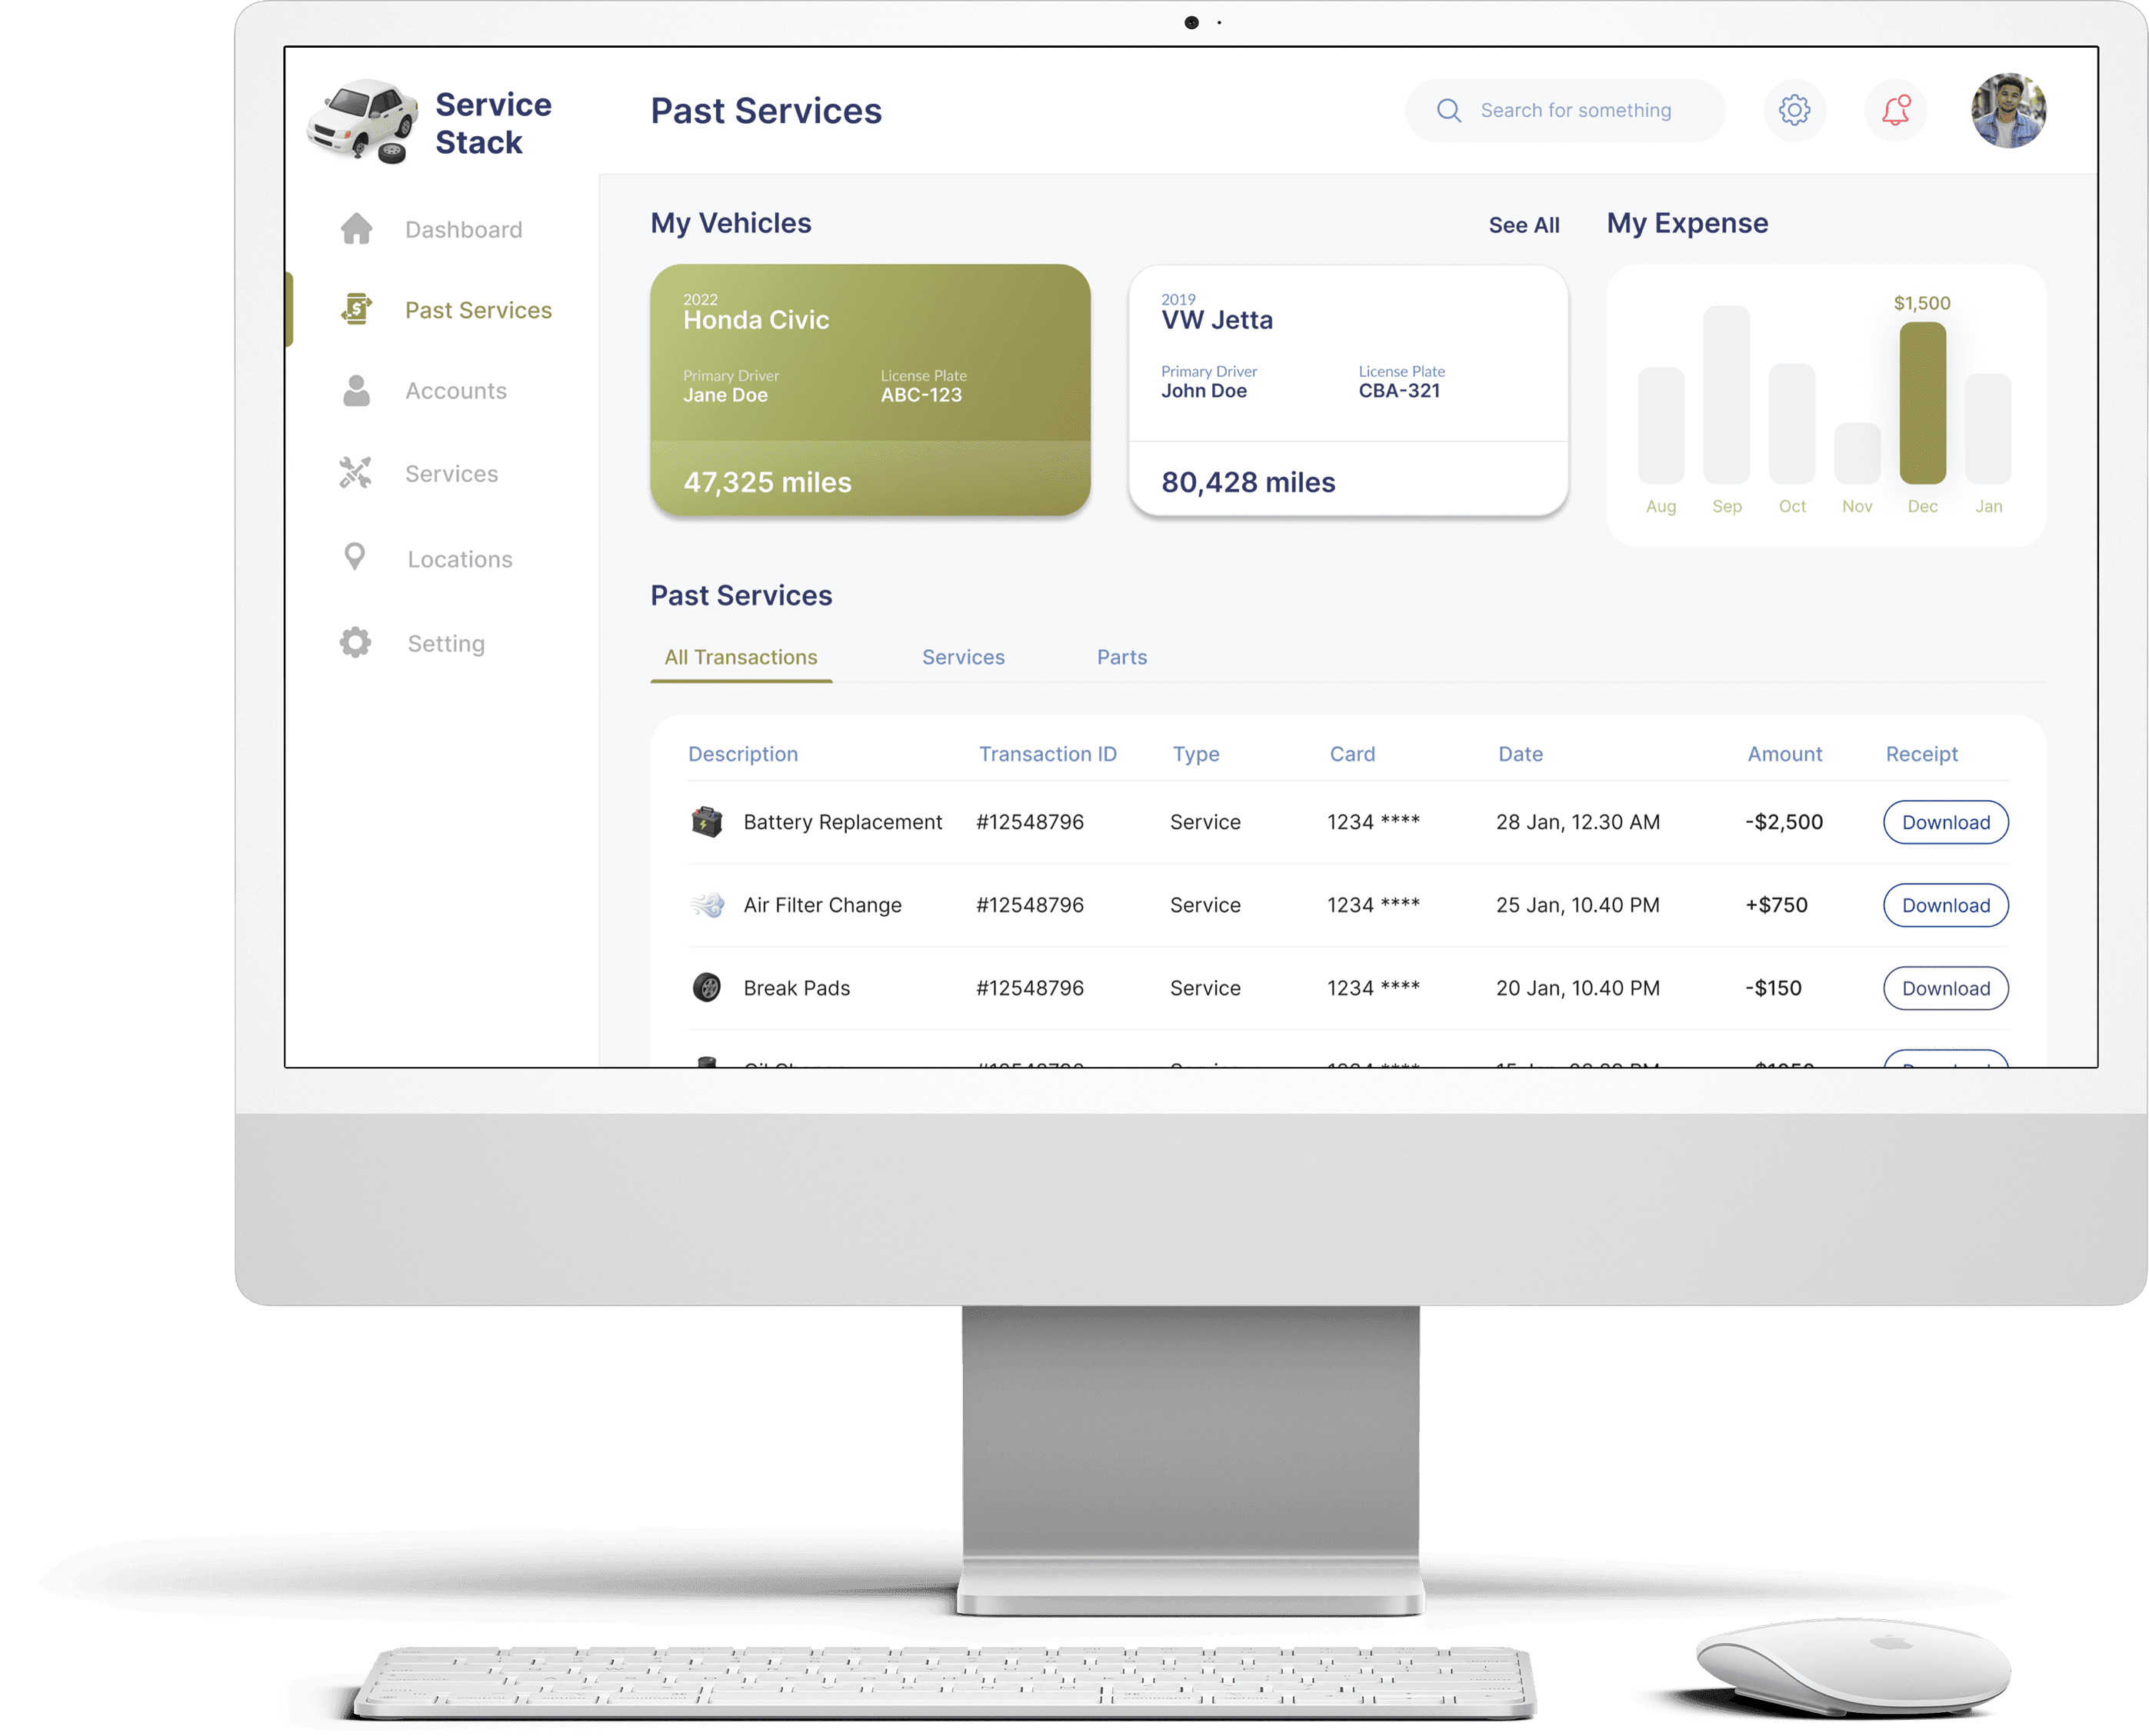
Service Stack is a clean, minimal dashboard that helps car owners stay on top of vehicle maintenance. Track service history, set reminders for upcoming work, and organize receipts all in one place. In partnership with local service shops, Service Stack syncs records for transparency on both sides.
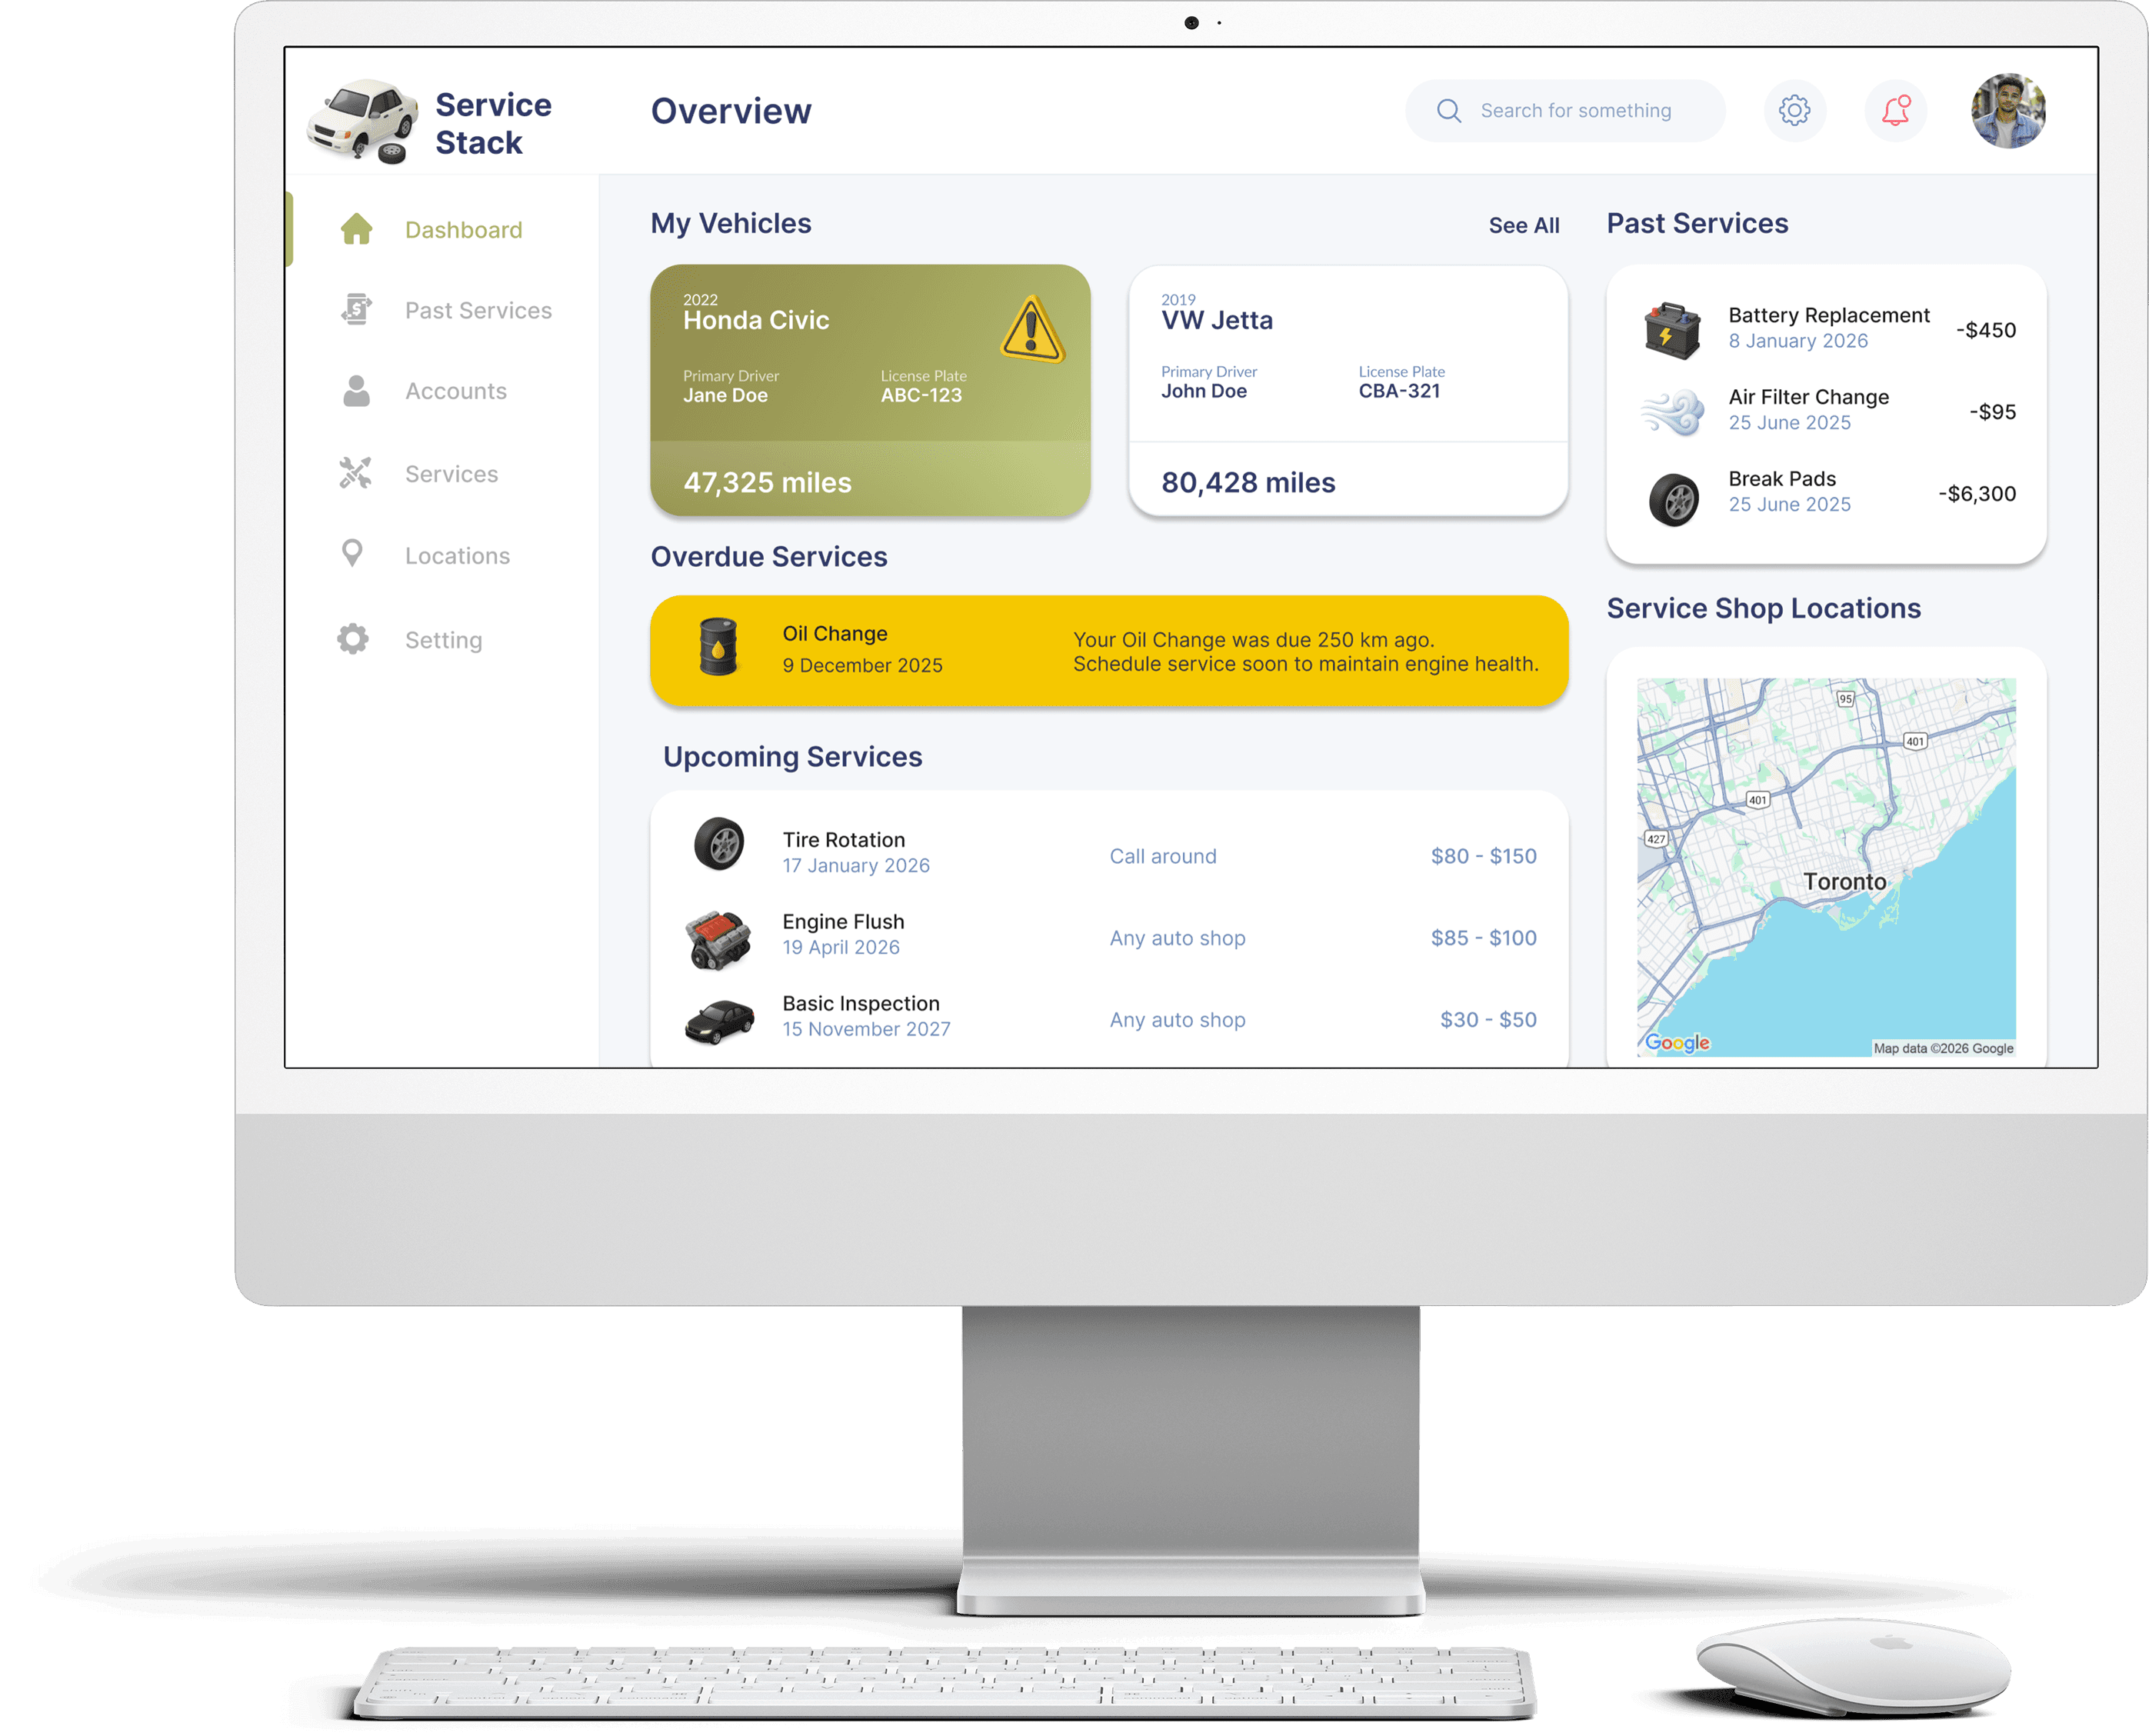
Organized & Standardized Invoice Tracking
During interviews, many people emphasized the need for invoice tracking, since they visit various auto shops. To solve this, Service Stack allows partnered shops to upload receipts after each visit, giving users a complete centralized service history.
Project Origin & Process
Originally developed during a UX design course at BrainStation in 2025, I took the project further and spent a few days doing site interviews. The insights from these while laying out the user journey map fundamentally changed the design.
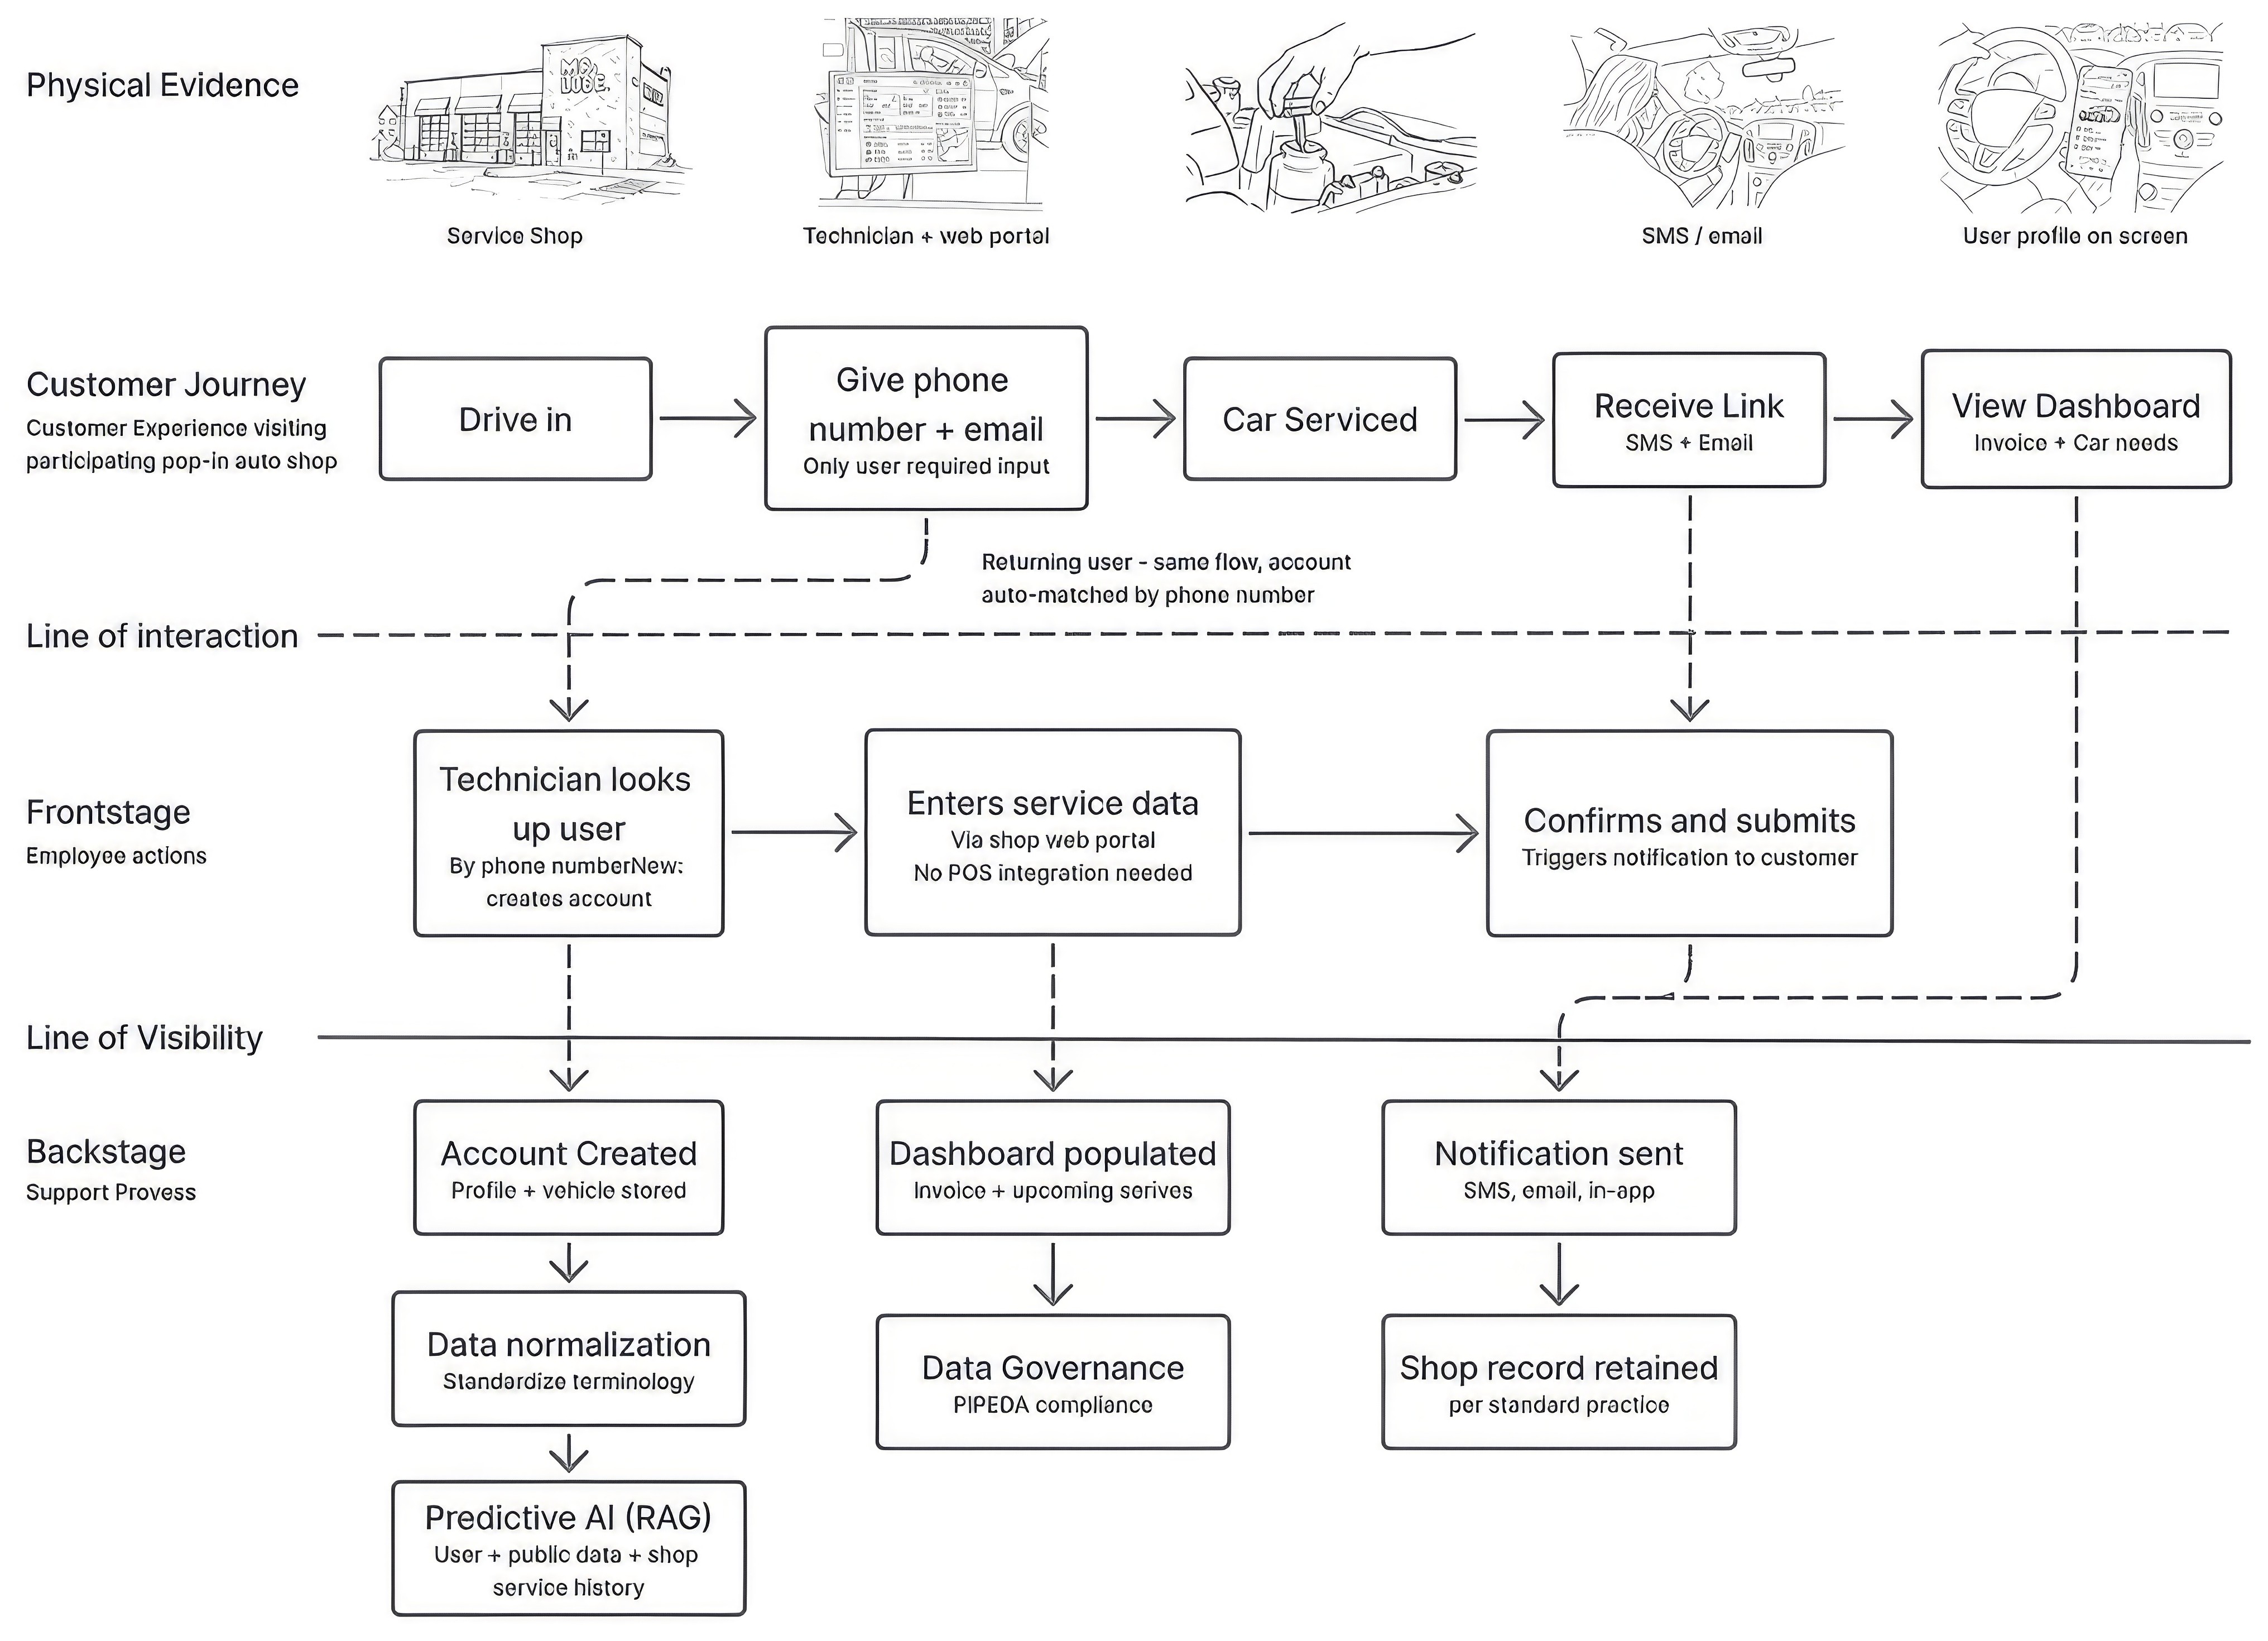
Participants showed little interest in adopting new technology independently which shifted onboarding entirely to the shop. Accounts are now created by the technician, not the customer.
The interviews also surfaced financial stress as a core driver. Many participants had switched from dealerships to pop-in shops to cut costs, arriving with no established relationship and no basis for trust.
Reflections
The most significant gap in this project is one the service blueprint made visible: the technician is a central actor in this service, but their perspective was never directly researched. Every design decision was informed by the customer's experience but the technician carries just as much weight in whether this service succeeds or fails in practice.
What are the pain points they experience tracking customer records? Can this service be integrated into their existing workflow? What do they know about customer anxiety that never makes it into an online review?
Those interviews would likely change the design in ways that are difficult to anticipate without doing them.
year
2025
timeframe
3 Months
tools
Figma, Miro, Lovable Dev
category
Service Design
01

see also